The Institute of Environmental Physics (IUP) at the University of Bremen is a world-leading institute in the field of evaluation and interpretation of global satellite measurements of the greenhouse gases carbon dioxide (CO2) and methane (CH4) and other atmospheric trace gases that are of great importance for climate and air quality. The institute leads the GHG-CCI greenhouse gas project of the European Space Agency's Climate Change Initiative (ESA) and provides related data to the European Copernicus Climate Change Service C3S and the Copernicus Atmospheric Monitoring Service CAMS. The latest Copernicus communication on greenhouse gases (see link below) is based on satellite data and analysis provided by IUP.
"The methane increase remains very high in 2022 at about 0.6%, but below the record levels of the past two years. Our guess for this is that on the one hand there have been more emissions, but at the same time the atmospheric methane sink has decreased. At just over 0.5%, the CO2 increase is similar to that of previous years," says environmental physicist Dr. Michael Buchwitz, summarizing the initial results.
Greenhouse gas measurements since 2002
Time series of greenhouse gas measurements from space begin in 2002 with the SCIAMACHY instrument on the European environmental satellite ENVISAT, proposed and scientifically leg by the University of Bremen. These measurements are currently being continued by Japanese (GOSAT and GOSAT-2) and American (OCO-2) satellites, among others.
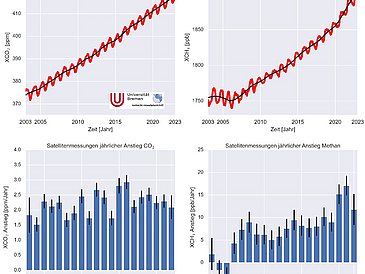
The satellites measure the vertically averaged mixing ratio of CO2 and CH4. These measurements are referred to as XCO2 and XCH4, and they differ from the commonly reported measurements of near-ground concentrations. The data are reported in parts per million (ppm) for CO2 and parts per billion (ppb) for CH4. An XCO2 concentration of 400 ppm means the atmosphere contains 400 CO2 molecules per one million air molecules. "Methane increased by 11.8 ppb in 2022, CO2 by 2.1 ppm," Buchwitz said.
The attached figure above shows the time course of the concentrations of both gases since 2003. As can be seen, CO2 increases almost uniformly - in contrast to methane. In the years 2000 to 2006, the methane concentration was stable on average. Since 2007, however, methane has been rising (again), with particularly high rates of increase in recent years (figure below). The record levels in 2020 and 2021 are likely associated with a COVID-19-induced increase in the methane sink, but also with an increase in methane emissions (see "Copernicus press release" for details).
"Unfortunately, there are still many gaps in our knowledge of the diverse natural and anthropogenic sources and sinks of methane and other greenhouse gases," Buchwitz says. "It is therefore still necessary to make optimal use of and further improve the existing system for global monitoring of climate-relevant parameters."
Additional information:
https://climate.copernicus.eu/copernicus-2022-was-year-climate-extremes-record-high-temperatures-and-rising-concentrations (Copernicus press release: 2022 was a year of climate extremes, with record high temperatures and rising concentrations of greenhouse gases)
https://atmosphere.copernicus.eu/ (Copernicus Climate Change Service (C3S)
https://atmosphere.copernicus.eu/ (Copernicus Atmosphere Monitoring Service (CAMS)
https://climate.esa.int/en/projects/ghgs/ (Greenhouse gas project GHG-CCI of ESA’s Climate Change Initiative)
www.iup.uni-bremen.de/ (Institute of Environmental Physics (IUP) at University of Bremen)
www.iup.uni-bremen.de/carbon_ghg (Website carbon and greenhouse group of IUP)
www.uni-bremen.de/en
Contact:
Dr. Michael Buchwitz
University of Bremen
Institute of Environmental Physics (IUP)
Phone: +49 421 218-62086
E-Mail: Michael.Buchwitzprotect me ?!iup.physik.uni-bremenprotect me ?!.de

