Steady-state thermal characterization
© Gordon Callsen
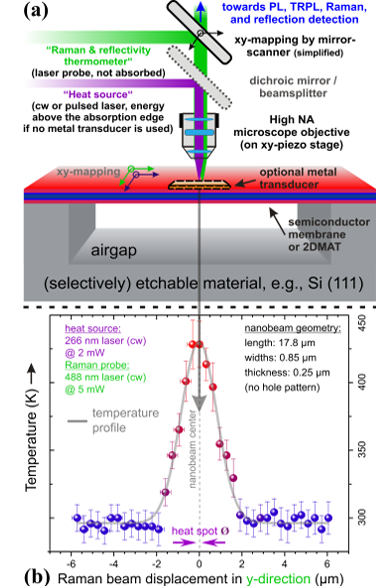
a) Schematic diagram of the envisaged experimental setup. As a result, a wide range of nanostructures becomes accessible for a combined photonic and thermal analysis. (b) Temperature profile extracted from a 2LRT mapscan (2-laser-Raman-thermometry) measured for a GaN nanobeam structure (dimensions given in the inset). The steady-state temperature distribution that is caused by a heating laser (purple) can be mapped by a second laser (green). Preliminary data.
This page is under construction, experimental details will be added shortly.