Koselleck
Reinhard-Koselleck Project
Experimental investigations concerning the coupling of reaction progress and permeability
Project description
Interactions between water and rock play an essential role in the geosciences. On the one hand, they regulate the climate-determining mass exchange between the earth's crust and the oceans. On the other hand they influence hydraulic and rock mechanical properties and are therefore of great importance in applied geosciences. In these interactions, volume changes of the solid phases continuously modify the distribution of porosity and permeability in the rock. The rates at which the crucial dissolution and precipitation reactions take place, in turn depend very much on the distribution of porosity and permeability. Little is known about these feedbacks between reaction sequence and pore space distribution, and this has repeatedly emerged as a problem in the assessment and prediction of system behaviour in the geosciences. Here, experimental work is proposed in which the focus is on systematic studies of these feedbacks. Flow experiments are to be carried out at elevated pressures and temperatures on rock bodies with corrosive or supersaturated solutions. The reactions thus initiated modify the geometry of the pore space. These changes are imaged by computer tomography (µ-CT), while time series analyses of the fluid compositions deliver information on the development of thermodynamic and kinetic parameters. The knowledge gained in these experiments will be used to parameterize numerical models for the prediction of coupled flow and mass transport processes.
Work in the project

Installation of a laboratory for X-ray microtomography (µ-CT)
We use a ProCon CT-ALPHA to non-destructively determine the spatial distribution of matter inside a sample. The method is based on the detection and localization of regions of different mass attenuation in the sample. Please find more information about the method on the website of our X-ray µ-CT laboratory.

Development of a new X-ray-transparent flow-through reaction cell for a µ-CT-based concomitant surveillance of the reaction progress of hydrothermal mineral–fluid interactions
A new flow-through reaction cell consisting of an X-ray-transparent semicrystalline thermoplastic has been developed for percolation experiments. Core holder, tubing and all confining parts are constructed using PEEK (polyetheretherketone) to allow concomitant surveillance of the reaction progress by X-ray microtomography. On the left: photograph of an ongoing percolation experiment: the percolation cell is located inside the oven, recharge- and discharge fluids are connected by PEEK capillary tubing. The pump system, recharge- and discharge fluid storage, and the board with the flow line are installed on a mobile rack. To facilitate the transfer of the percolation experiment from the oven laboratory to the X-ray microtomography laboratory for scanning, the mobile rack is equipped with an uninterruptible power supply; On the right: photograph of the assembled cell, with PEEK tubing 1/1600 (1.60 mm) O.D. attached.
Figure is modified afterKahl et al. (2016).
Combination of experimental simulation and µ-CT survey
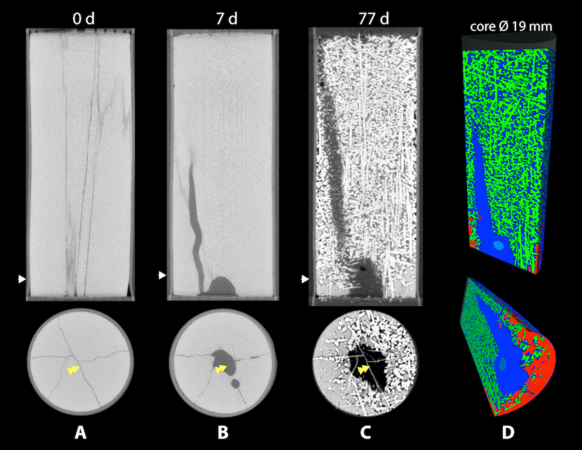
4-D series of the conversion from gypsum to anhydrite (77 days at 110 °C, fluid pressure 45 bar (4.5 MPa) with gypsum-saturated fluid). In the course of the experiment, the gypsum single crystal (artificially fissured for fluid permeability) has almost completely converted to acicular anhydrite. A 3-D model of the final stage shows the last remains of gypsum near flow-in.
Figure taken from: Kahl, W.-A., Hansen, C., and Bach, W. (2016) A new X-ray-transparent flow-through reaction cell for a µ-CT-based concomitant surveillance of the reaction progress of hydrothermal mineral–fluid interactions. Solid Earth, 7, 651-658.doi:10.5194/se-7-651-2016
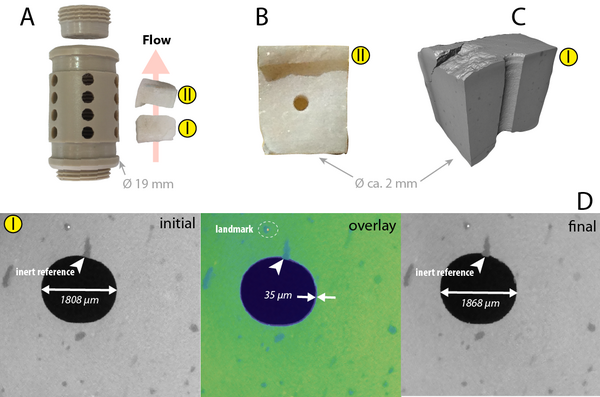
Crystal surface reactivity analysis of marble in a perforated PEEK chamber within the flow cell in a flow-through experiment
Visualization of (A) the perforated PEEK chamber for sample assembly in a flow-through experiment with marble; (B) bottom-view of sample; (C) section through volume reconstruction. Image sequence of a single reconstructed slice (D) visualizes the surface retreat (overlay) of calcite by comparison of the unreacted (top: initial) vs. reacted (bottom: final) state of the experiment. The view is down the central hole of the sample.
Figure is modified after Kahl et al. (2020) doi: 10.2475/01.2020.03
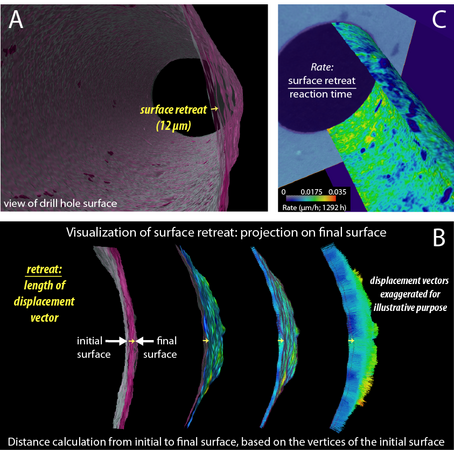
Quantitative 3-D digital image analysis to determine reaction progress by a X-ray µ-CT survey
Determination of surface retreat and rate map calculations from µ-CT volume data. (A) Material loss in the course of the flow-through experiment; (B) Principle of distance measures between initial and final mineral surface; (C) The conversion of a surface distance map into a rate map (µm/h) is achieved by division of surface retreat by reaction time.
Figure is modified after: Kahl et al. (2020) doi: 10.2475/01.2020.03
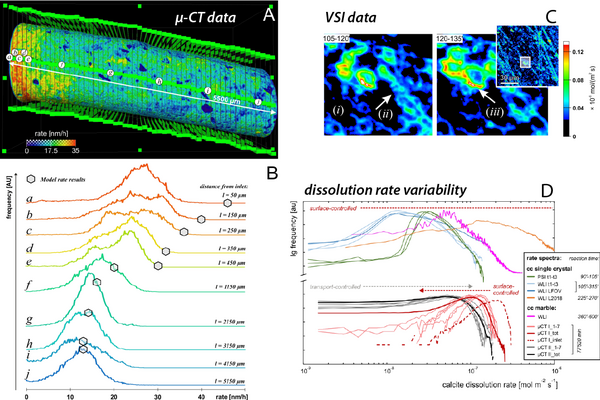
Crystal surface reactivity analysis using a combined approach of X-ray micro-computed tomography (µ-CT) and vertical scanning interferometry (VSI)
Characterization of the dissolution rate variability covering the nm- to mm-scale of dissolving single-crystal and polycrystalline calcite samples. (A) µ-CT-derived ratemap after 54 days of percolation experiment; (B) Spatial variability of the frequency distribution of dissolution rates derived from a µ-CT survey covering 5.5 mm of marble surface; (C) Spatial variability of the frequency distribution of dissolution rates in a VSI experiment; (D) Compilation of calcite single-crystal and polycrystalline calcite dissolution rate variability from µ-CT and VSI observations.
Figure is modified after: Kahl, W.-A., Yuan, T., Bollermann, T., Bach, W., Fischer, C. (2020) Crystal surface reactivity analysis using a combined approach of X-ray micro-computed tomography and vertical scanning interferometry. American Journal of Science, 320(1), 27-52. doi: 10.2475/01.2020.03
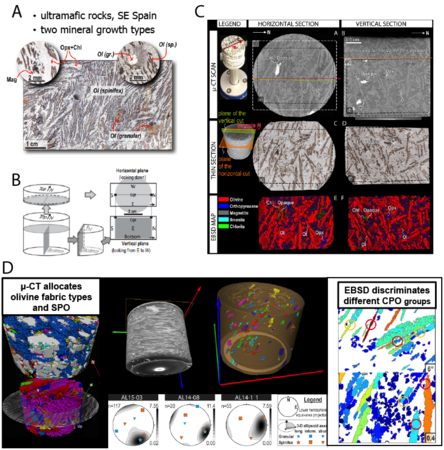
3-D microstructure of olivine in deserpentinized ultramafic rocks reconstructed by correlative X-ray µ-CT and electron backscatter diffraction (EBSD) analyses
Correlative µ-CT- and EBSD analyses of the 3-D microstructure of olivine. (A) Granular and spinifex olivine form as two different mineral growth types upon dehydration of serpentinite; (B) Semi-destructive approach of correlative µ-CT- and EBSD analyses; (C) Correlation of µ-CT and EBSD data to facilitate proper correlation of orientation information; (D) Characterisation of olivine microfabric and shape by µ-CT, and crystal orientations byEBSD.
Figure is modified after: Kahl et al. (2017) doi:10.1111/jmi.12598
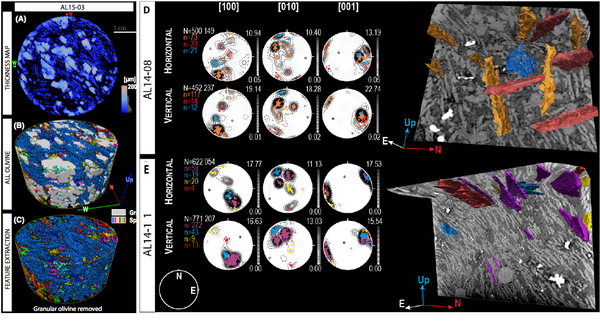
Characterisation of the 3-D microstructure of olivine as primary reaction product of deserpentinisation by digital image analysis
Digital image analysis to characterise the microstructure of granofels and spinifex olivine by combined shape and crystallographic orientation. (A) Local thickness map (i.e. a color-coded representation of the structural thickness) of one slice of the data volume; (B) 3-D models of granular (rendered white) and spinifex olivine; (C) Visualisation of feature extraction by removing the granular olivine crystals; (D,E) Characterisation of the microstructure of spinifex olivine by combined shape and crystallographic orientation in samples AL14-08 (D) and AL14-11 (E).
Figure is modified after: Kahl, W.-A., Dilissen, N., Hidas, K., Garrido, C. J., López-Sánchez-Vizcaíno, V. andRomán-Alpiste, M. J. (2017): 3-D microstructure of olivine in complex geological materials reconstructed by correlative X-ray µ-CT and EBSD analyses. Journal of Microscopy 268, 193-207. doi:10.1111/jmi.12598
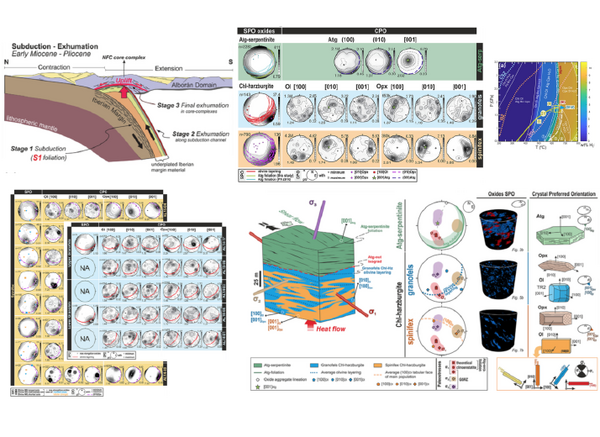
Textural evolution during high-pressure dehydration of serpentinite to peridotite and its relation to stress orientations and kinematics of subducting slabs
The correlative X-ray micro-computed tomography (µ-CT) and Electron Backscatter Diffraction (EBSD) study of oriented samples across the Atg-serpentinite dehydration isograd of the Almirez massif provides a detailed account of the textural evolution during high-P serpentinite dehydration to peridotite. Crystallization of granofels and spinifex Chl-harzburgite records, respectively, a sequence of slow and fast fluid draining events during serpentinite dehydration under the same orientation of the principal stresses that resulted in the Atg-serpentinite shear deformation. The ESE–WNW oxide aggregate lineation of spinifex and granofels Chl-harzburgites and the [001] Ol platelet lineation of the spinifex tabular olivines subparallel to σ2 could mark the along strike paleoflow direction of fluids below the Atg-out dehydration front.
Figure is modified after: Dilissen, N., Hidas, K., Garrido, C. J., Kahl, W.-A., Sánchez-Vizcaíno, V. C., Padrón-Navarta, J. A. (2018) Lithos, 320-321, 470-489. doi: 10.1016/j.lithos.2018.09.033