(Reactive) CFD and MRI in catalytic reactors
The use of renewable energies inevitably leads to fluctuations in electricity production, which is why concepts such as power-to-gas (PtG) and power-to-liquid (PtL) are increasingly becoming the focus of research and society. These are potentially good options for storing surplus electricity, which applies, for example, to the methanization of CO2 and Fischer-Tropsch synthesis (FTS).
Catalytic reactors form the cornerstone of many processes in the chemical industry and are also the basis for these PtG and PtL processes. Despite the widespread use of catalytic reactors for well over 100 years, knowledge of the local conditions in the reactors is very limited. However, this knowledge is essential for optimizing the processes as a whole and thus making them more economical and ecological. The field of computational fluid dynamics (CFD) offers completely new possibilities for simulating the processes in the reactors with high resolution and thus expanding fundamental knowledge about the local process conditions.
In our working group, we combine reactive CFD (rCFD), which simulates not only flow and heat transfer but also chemical reactions, with magnetic resonance imaging (MRI) in the gas phase. This is particularly challenging because gases generate very little signal in magnetic resonance imaging due to their low density, requiring a special procedure. A novel method makes it possible to measure species concentrations and temperature directly in the gas phase. The results can be found in Kevin Kuhlmann's dissertation and are shown in excerpts here.

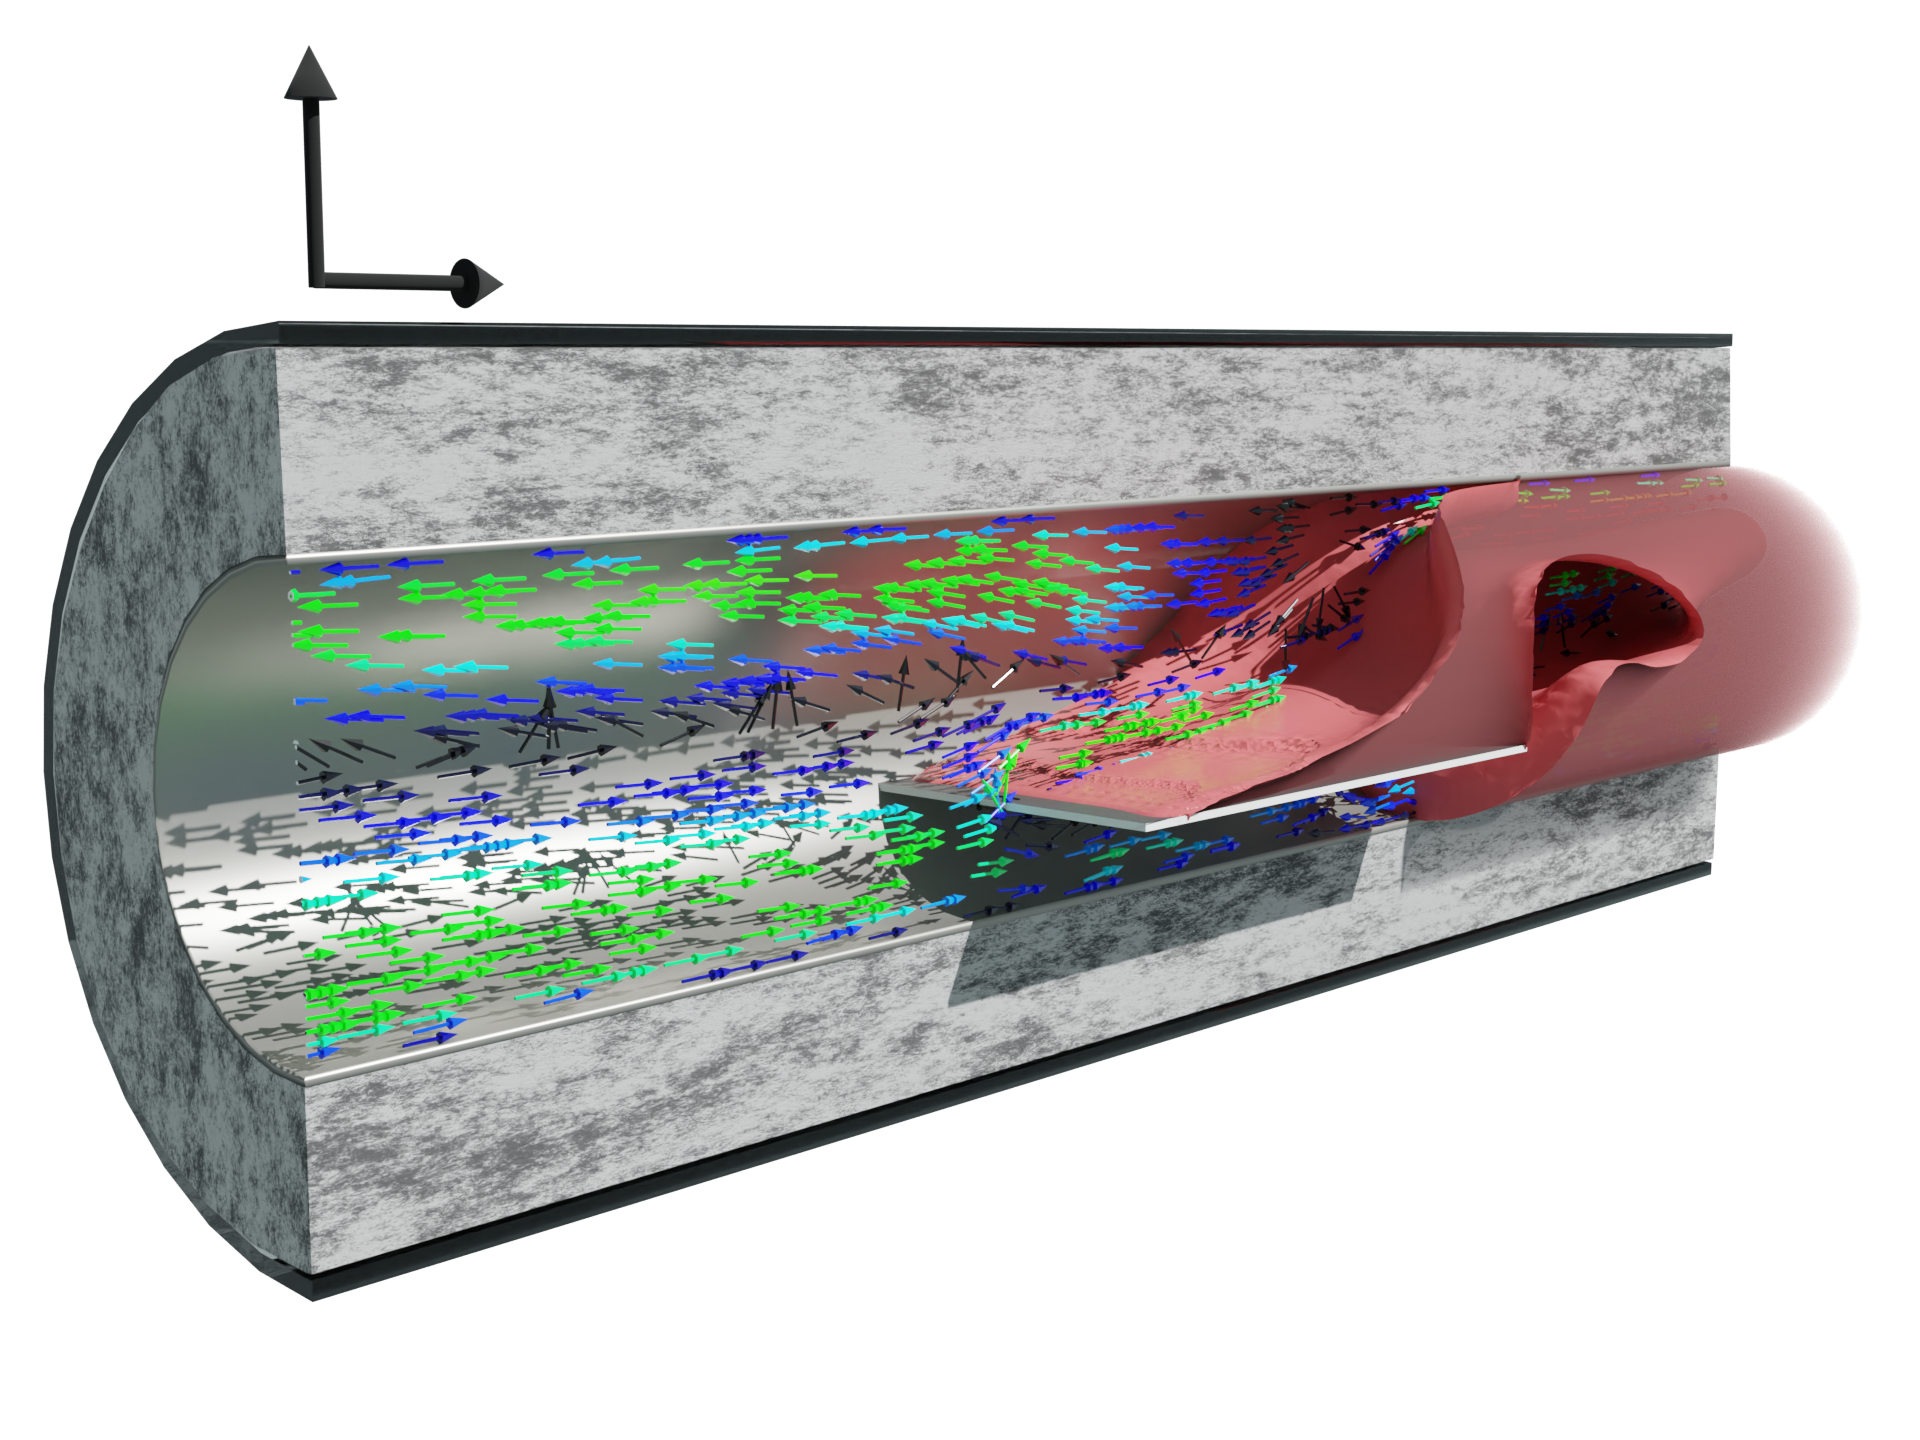
3D product formation and section comparison of MRI and rCFD data for ethene hydrogenation on a Pt catalyst. a Vector field on the y-z plane representing the flow direction and isosurface separating the regions above (hazy region) and below the molar product ratio of xC2H6 = 0.235. b Comparison of ethene conversion (XC) on the x-y plane. Between MRI and rCFD. c Comparison of the temperature fields on the y-z plane. d Comparison of the XC fields on the y-z plane.

Prepared MRI room for experiments on the catalyzed hydrogenation reaction. The catalytic reactor is located in the tomograph. a Supply hose for temperature control fluid. b Glass cylinder for pre-adsorption of water on the glass surface. c Gas mixture supply hose. d Magnetic resonance tomograph.
Relevant publications in this field
Kuhlmann, K. (2025). Exploring Catalytic Reactors using Computational Fluid Dynamics: Insights and Limitations. Dissertation, Universität Bremen (Germany).
Contact
Dr.-Ing. Kevin Kuhlmann
Room UFT 2190
Tel. 0421- 218 - 63394
k.kuhlmannprotect me ?!uni-bremenprotect me ?!.de